PetroVR 2024 v2 Release Notes
PetroVR 2024 v2 introduces new modeling options, with a strong focus on Energy Transition and Non-Conventional Oil and Gas projects. Notably, it adds support for Geothermal Energy and WAG (Water-Alternating-Gas) production patterns, expanding the range of project types that can leverage PetroVR's powerful methodology for concept selection under uncertainty.
This version also introduces parallel processing for Excel Cases—the PetroVR tool that allows users to run multiple project variations by sequentially adjusting parameters from an Excel spreadsheet. This enhancement fully utilizes all available processing cores on your machine, significantly improving computational efficiency.
Additionally, this release features improved integration with Planning Space, enabling detailed probabilistic data export to Dataflow and enhanced communication with Economics through EaaS (Economics-as-a-Service). Numerous other minor improvements in speed and user experience have also been implemented.
Earlier this year we included other powerful modeling options focused on Energy Transition projects (H2 Electrolysis facilities, CO2 emission management, enhanced Power Plants) and Exploration projects. Those options are documented here: PetroVR 2024 Release Notes.
PetroVR 2024 v2 New Capabilities
Energy Transition: Geothermal Projects
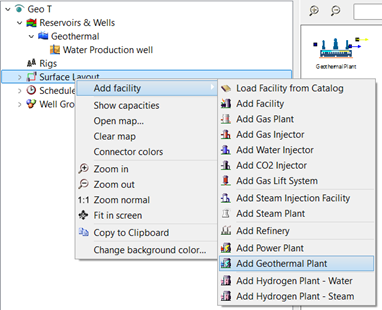
This version of PetroVR introduces the ability to model Geothermal projects with new first-class objects: the Water Reservoir, the Water Production Well, and a Geothermal Power Generation Facility. These capabilities require the special Thermal PetroVR license.
Developing a geothermal project in PetroVR is as straightforward as creating a standard Oil and Gas project. The Geothermal Reservoir includes the ability to set the water/steam temperature, and optionally, the contaminants present in it.
Within the reservoir, Water Production Wells can be drilled. They are like other production wells in PetroVR, except that the primary—and only—fluid produced is water. These wells can be connected either directly or indirectly to a Geothermal Plant, which converts water or steam into electrical power.
The critical parameter in the Geothermal Plant is the "Power per Water Rate," which enables you to specify the plant’s electric power generation capacity. In this field, a custom function can be written, to make power generation dependent on variables such as the temperature of the incoming water.
Gas Alternating Water Injection in Production Patterns
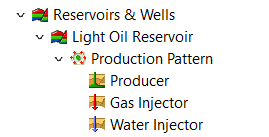
Now it is possible to include multiple injectors inside a production pattern and coordinate its performance in a single table together with the producers belonging to the pattern. This enables WAG production patterns, as well as any other combination of production patterns, modeling the mutual dependencies between producers and injectors.
Integration with Quorum Products
Probabilistic Results Exported to Dataflow
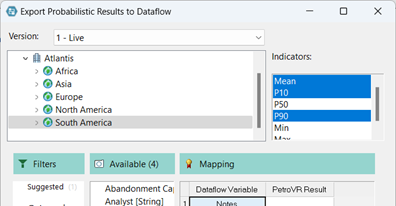
This version completes the support to export all probabilistic indicators to Dataflow when exporting Monte Carlo runs of models and scenarios. Mean, P10, P50, P90, Min, and Max values can populate their respective scenarios on the selected Dataflow document.
Speed and Performance
Multi-core for Excel Cases
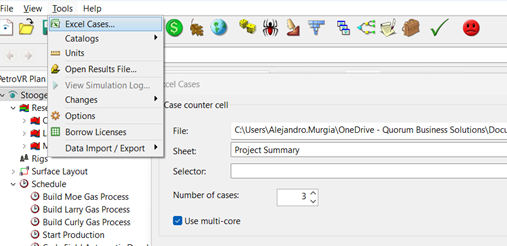
The same extension of Multi-Core processing that recently enabled parallel processing in Sensitivities tools has been now implemented for Excel Cases. You can now run multiple project variations by sequentially adjusting parameters from an Excel spreadsheet. This option significantly improves computational efficiency and completes the support for Multi-Core on all the PetroVR tools that can benefit from it.
Probabilistic Graphs for Excel Cases
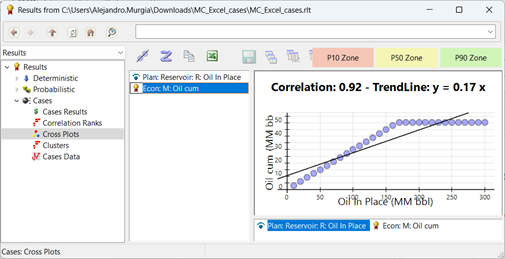
The Excel Cases Result node has been enriched with the whole family of Result Groups that PetroVR provides for probabilistic runs: correlation ranks, cross plots, clusters, and data node are available after running the tool.
Variable Navigator
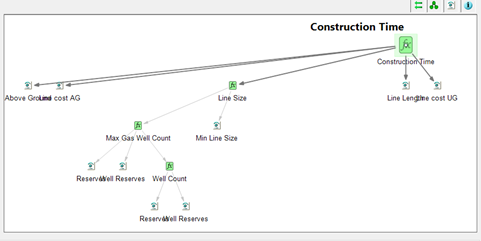
The Dependency Graph, originally introduced as a tool for visually navigating and editing function inputs, has now evolved into a comprehensive Variable Navigator. This feature enables you to click and edit any function directly within the graph, providing seamless navigation both upwards to references and downwards to dependencies. Additionally, the Variable Navigator is now integrated into the PetroVR Plan Variables tree view in the main window, expanding its accessibility beyond the function editor.
Modeling
Report Rates Using the Active Part of the Period
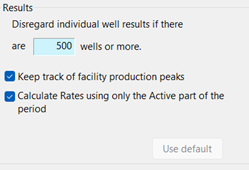
PetroVR reports rates (both in the Result window and Excel reports) by dividing the period production by the total days in the period. From this version on, this option is the default, but a second one is available to report rates as period production divided by the active part of the period, to reflect the actual average rate of a well or facility’s first and last period of production.
Keep Track of Production Peaks
A new result has been added to the library of production variables, reporting the peak rate of all facilities in each period. The new result is called Max Rate. To enable this result, check the option in the Preferences tab of the main PetroVR tree node. A runtime variable has been also added with the same information.
Automatic Generation of Reservoir Success Milestone
Now, when you first edit a reservoir Probability of Success, a prompt invites you to automatically create a Reservoir Success Milestone job. This milestone provides a handy way to tie a series of jobs in the schedule to the success of one or more reservoirs. Now you can check the success of the listed reservoirs in two ways: either the milestone is reached when All reservoirs are successful, or when Any reservoir is.
Enhancements and tests included in this version
Several enhancements have been implemented impacting communication with Planning Space, GUI, results, validations, modeling flexibility and user experience.
- 41 enhancements delivered as updates during 2024
- 200 new functional test cases
- 205 new unit tests
